Los Angeles County Station Fire, 2009
On August 26, 2009, a fire broke out in the Angeles National Forest for several weeks. The Station Fire was the largest fire to ever occur in the Los Angeles County. Even on the state level, the Station Fire of 2009 is now “the tenth largest wildfire in modern California history” (Wonaschütz). In fact, in a matter of hours, the fire expanded from 45,000 acres to well over 100,000 acres (Marciano). The immensity of the Station Fire thus makes people ask many questions. One of these, which will be addressed with the help of the following maps, is the effect and extent of the fire on its neighboring communities.


The second map above is another reference map that specifies the location of the Station Fire a little more. On a larger scale than the first map, this map shows the proximity of the fire to the surrounding major cities as well as the corresponding freeways that act as networks between cities. While this map shows us that the fire did not expand to many freeways or cities, we cannot really tell if there is an overlap between the fire and the populated areas. As a result, we need further analysis to determine that indeed thousands of evacuations were necessary during the duration of the Station Fire (Marciano). In fact, the Station Fire ranged from the Sunland-Tujunga are to the eastern Altadena area as well as the all the way up to Acton (The Associated Press).

As a result, the third map above shows the effect of the Station Fire on some of the most populated areas in the Los Angeles County. For this map, I found data of populated places as polygons instead of points because we can easily layer the spread of the fire over several areas. Using the effects toolbar, I was able to make the fire perimeter layer transparent enough to show the overlap. Clearly, some of the directly affected areas include La Crescenta, Glendale, and La Canada-Flintridge. However, some places were more severely affected than others. Furthermore, I included local hospital locations as points in order to show where the people affected could get help. This is especially crucial since well over 10,000 houses were forced to evacuate and still some were stubborn to leave their homes (Marciano). It is interesting to see that most of the hospitals are found very close to the freeways, which made them very accessible during the Station Fire. Such accessibility was necessary. For instance, at one point, officials had to rescue people trapped in their ranch because they did not follow mandatory evacuations (The Associated Press). Injuries occurred as a result of similar incidents.

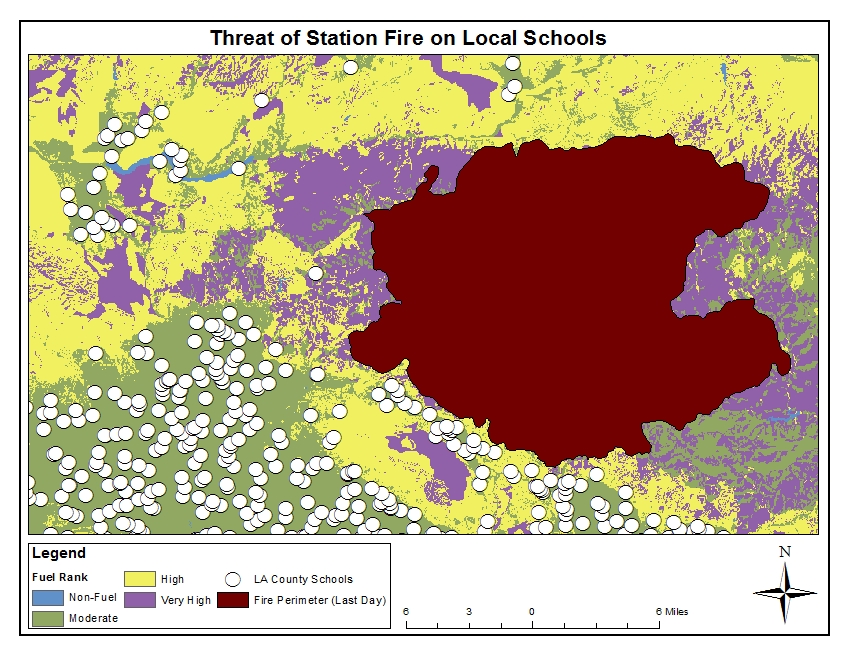
My final map provides schools as an example of a structure in the neighboring communities that were at risk through the duration of the fire. To do this, I used data on the fuel rank of the Los Angeles County. Specifically, the fuel rankings area assigned based on expected fire behavior for specific combinations of topography and vegetation under a severe weather condition. On my map, blue areas indicate hardly any fire threat, green areas indicate moderate threat, yellow areas indicate high threat, and purple areas indicate very high fire threat. The first thing that stood put when I initially put this map together was that for the most part, schools are build in zones with moderate fuel rankings. A relatively few number of schools are built on zones that can be highly dangerous in case of a fire. We can also see that fortunately no schools were burned down by the fire. However, it is clear that many schools must have remained closed until the fire was contained. In fact, all of the schools in the Glendale Unified School district were closed and had to push back the start of the school year due to poor air quality ("Station Fire Update"). In addition, La Canada Unified School District enforced the same rule to all of its schools (William-Ross). Schools in the Pasadena Unified District as well as the Los Angeles Unified district suspended their outdoor athletic activities (Barge).
Due to the severity of the fire, it is clear that many communities were at risk. In this report, I show that specifically the communities neighboring the fire were most at risk. In addition, some communities were hit harder than others as evidenced by the number of evacuations and number of homes lost. The final map shows the schools within the affected communities to further demonstrate the gravity of the situation. On another note, ArcGIS was a very useful tool for this assignment, for it made comparisons and relationships very easy to make.
Works Cited:
Barge, Evelyn. "Station Fire Resources and Blogroll for Up-to-minute Information." Rose Magazine. 29 Aug. 2009. Web. 08 Dec. 2012.
Garrison, Jessica. "Station Fire Claims 18 Homes and Two Firefighters." Los Angeles Times. Los Angeles Times, 31 Aug. 2009. Web. 08 Dec. 2012.
Marciano, Rob, et. Al. "'Angry Fire' Roars across 100,000 California Acres." CNN. Cable News Network, 31 Aug. 2009. Web. 08 Dec. 2012.
"Station Fire Update." City of Glendale California. 30 Aug. 2009. Web. 08 Dec. 2012.
The Associated Press. "53 Structures Burned in Station Fire." ABC 7 News. ABC, 31 Aug. 2009. Web. 08 Dec. 2012.
William-Ross, Lindsay. "Station Fire Update: Evacuations, School Closures & Other Info." LAist. 30 Aug. 2009. Web. 08 Dec. 2012.
Wonaschütz, A., et. Al. "Impact of a Large Wildfire on Water-soluble Organic Aerosol in a Major Urban Area: The 2009 Station Fire in Los Angeles County." Atmospheric Chemistry and Physics 11.16 (2011): 8257-270. Print.
Data Sources:
http://gis.ats.ucla.edu/mapshare/
http://frap.cdf.ca.gov/data/frapgisdata/download.asp?rec=frnk
http://egis3.lacounty.gov/eGIS/category/gis-data/fire/